Current economic conditions continue to challenge companies across all industries, diminishing demand and increasing competition. As a result, many business owners are being forced to focus their efforts on maximizing bottom-line returns in the face of poor top-line growth. This often means minimizing operating costs in order to grow operating margins.
This is especially relevant to fleet managers, whose fleet costs often make up a large portion of their company’s total operating budget. Unfortunately, cost savings opportunities can be difficult to spot. Telematics can help in this effort. With telematics, fleet managers can identify and quantify fleet-wide savings opportunities, and implement the proper driver management initiatives to achieve them.
In this blog post, we discuss the difference between fleet management ROI and COI and introduce a new tool that can be used to help fleet managers identify and quantify strategic savings opportunities throughout their fleet operations.
What is COI?
COI — or Cost of Ignoring — can be thought of as the amount of lost savings that result when a company fails to undertake a strategic business investment that would otherwise improve operational efficiency. In other words, for fleet managers, it can be thought of as the incremental operating costs resulting from the improper use of telematics (or in some cases the complete lack of telematics).
ROI vs. COI
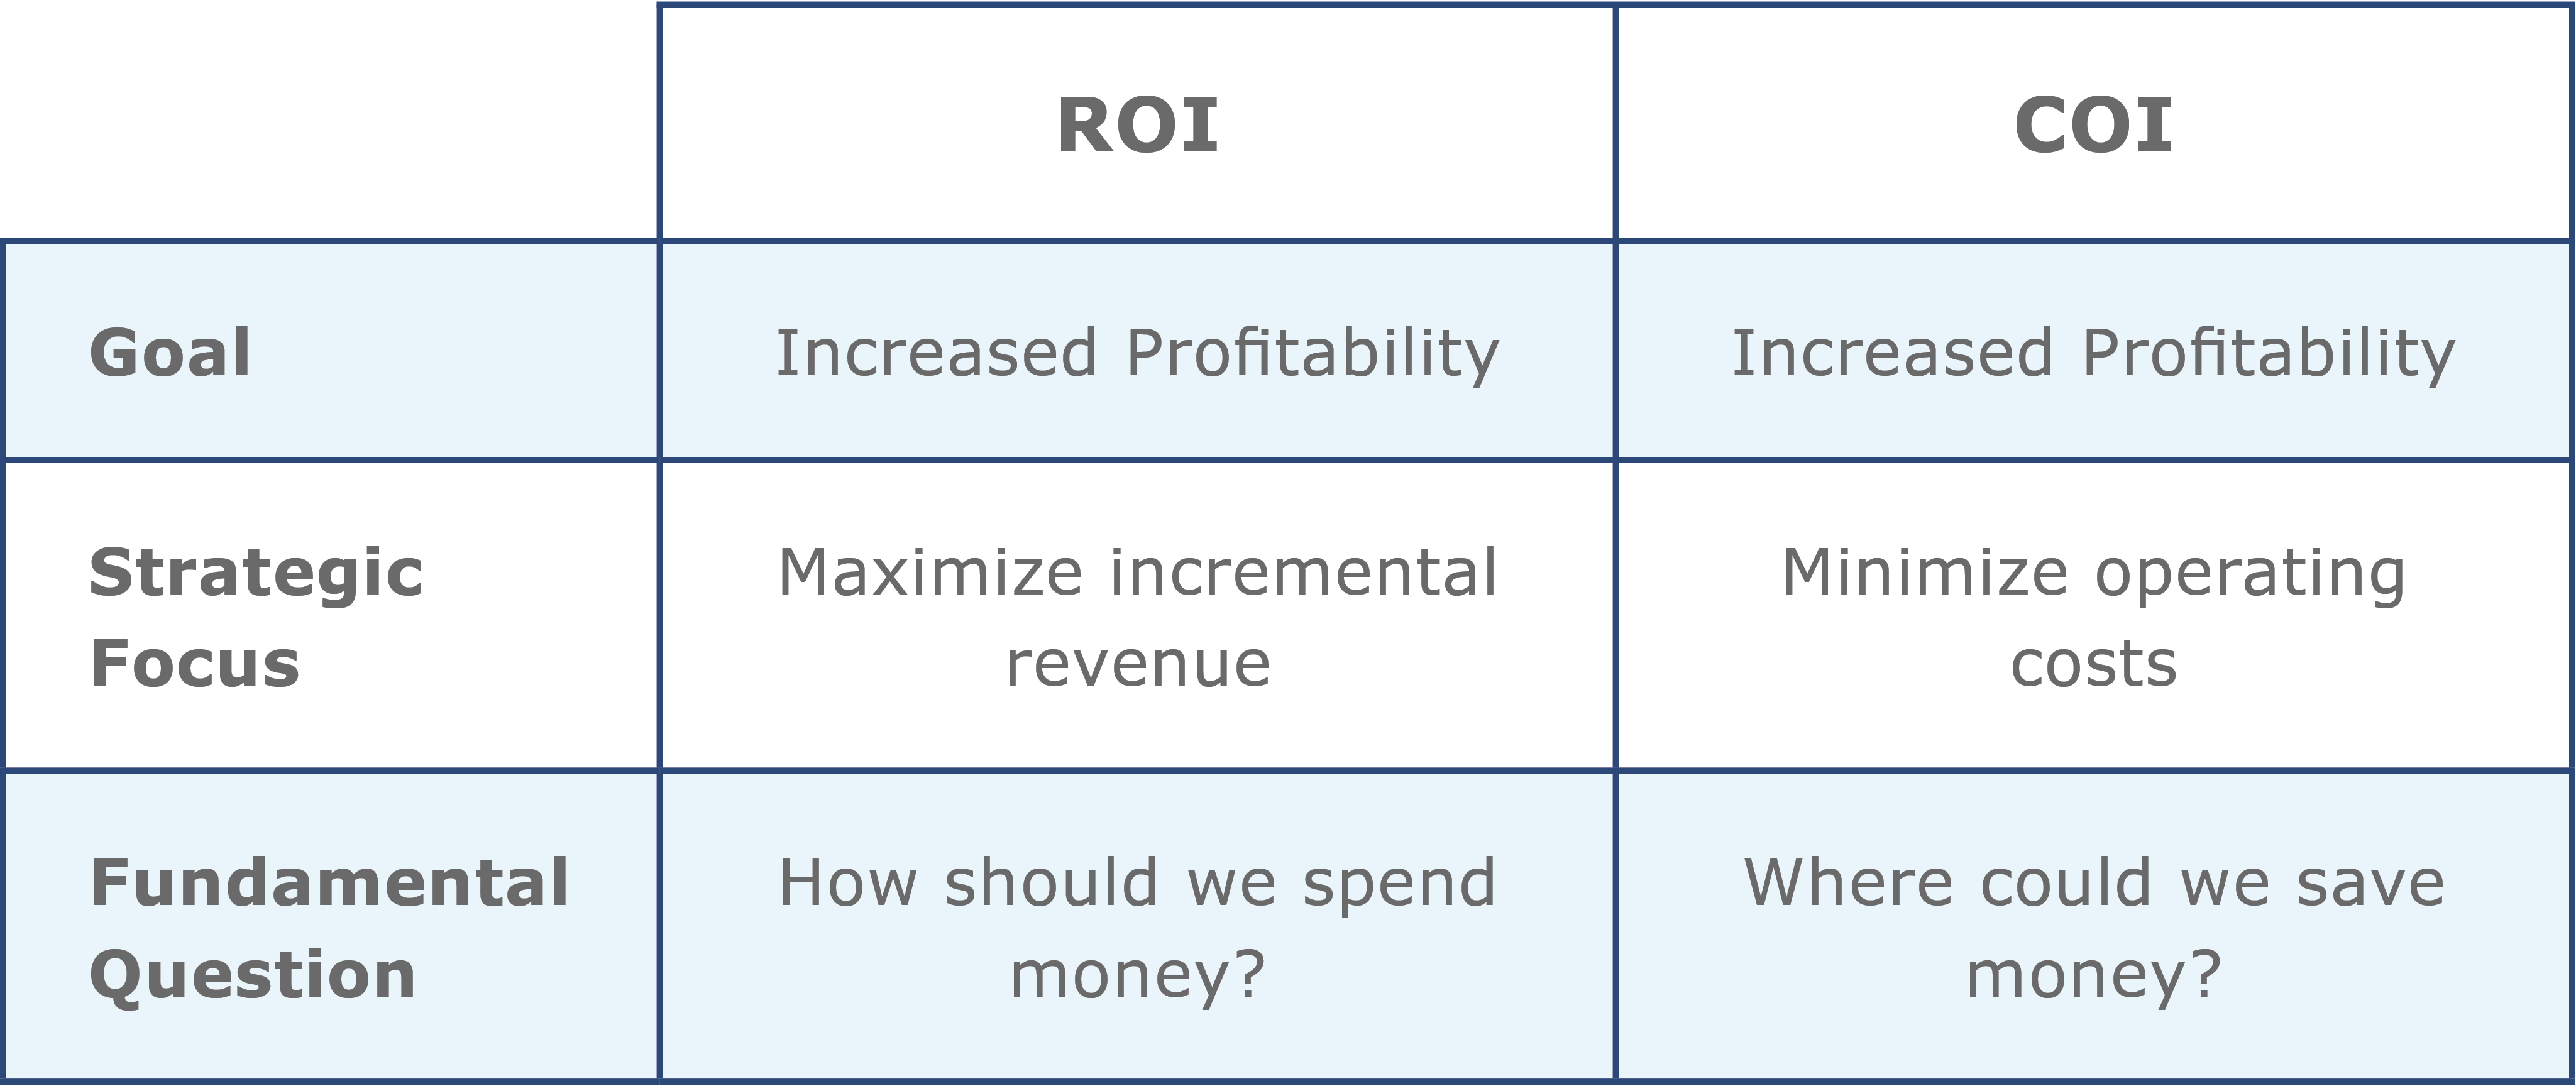
Although COI has the same strategic objective as its better-known cousin Return on Investment (ROI), there are a few fundamental differences, as captured in the table below. In summary, COI is focused on minimizing operating costs, whereas ROI is focused on maximizing incremental revenue.
Where Should I Look For Savings?
Each fleet is unique, and therefore each fleet can have drastically different cost structures. In our research, we found that two variables in particular impacted a fleet’s operating costs: vehicle class and vehicle mileage.
For example, a long-haul Heavy-Duty (HD) fleet will have a very different Cost per KM (CpKm) breakdown than a low-mileage Light-Duty (LD) fleet. In general, the HD fleet will likely have larger proportional fuel expenses per km compared to the LD fleet which will have larger collision and claims costs per km.
As a result, the savings opportunities available to a specific fleet will change based on the fleet’s operating characteristics, making them difficult to quantify.
Introducing the Fleet Savings Summary Report
To help fleet managers assess their COI and identify strategic savings opportunities, Geotab created the Fleet Savings Summary Report. This free report can be requested from the Geotab Marketplace.
The report illustrates a fleet’s existing and potential savings, and subsequently shows a fleet manager where to focus driver coaching efforts in order to minimize their fleet’s Total Cost of Ownership (TCO).
The Fleet Savings Summary Report breaks down a fleet’s cost-saving opportunities into four categories: Safety, Fuel, Maintenance, and Productivity.
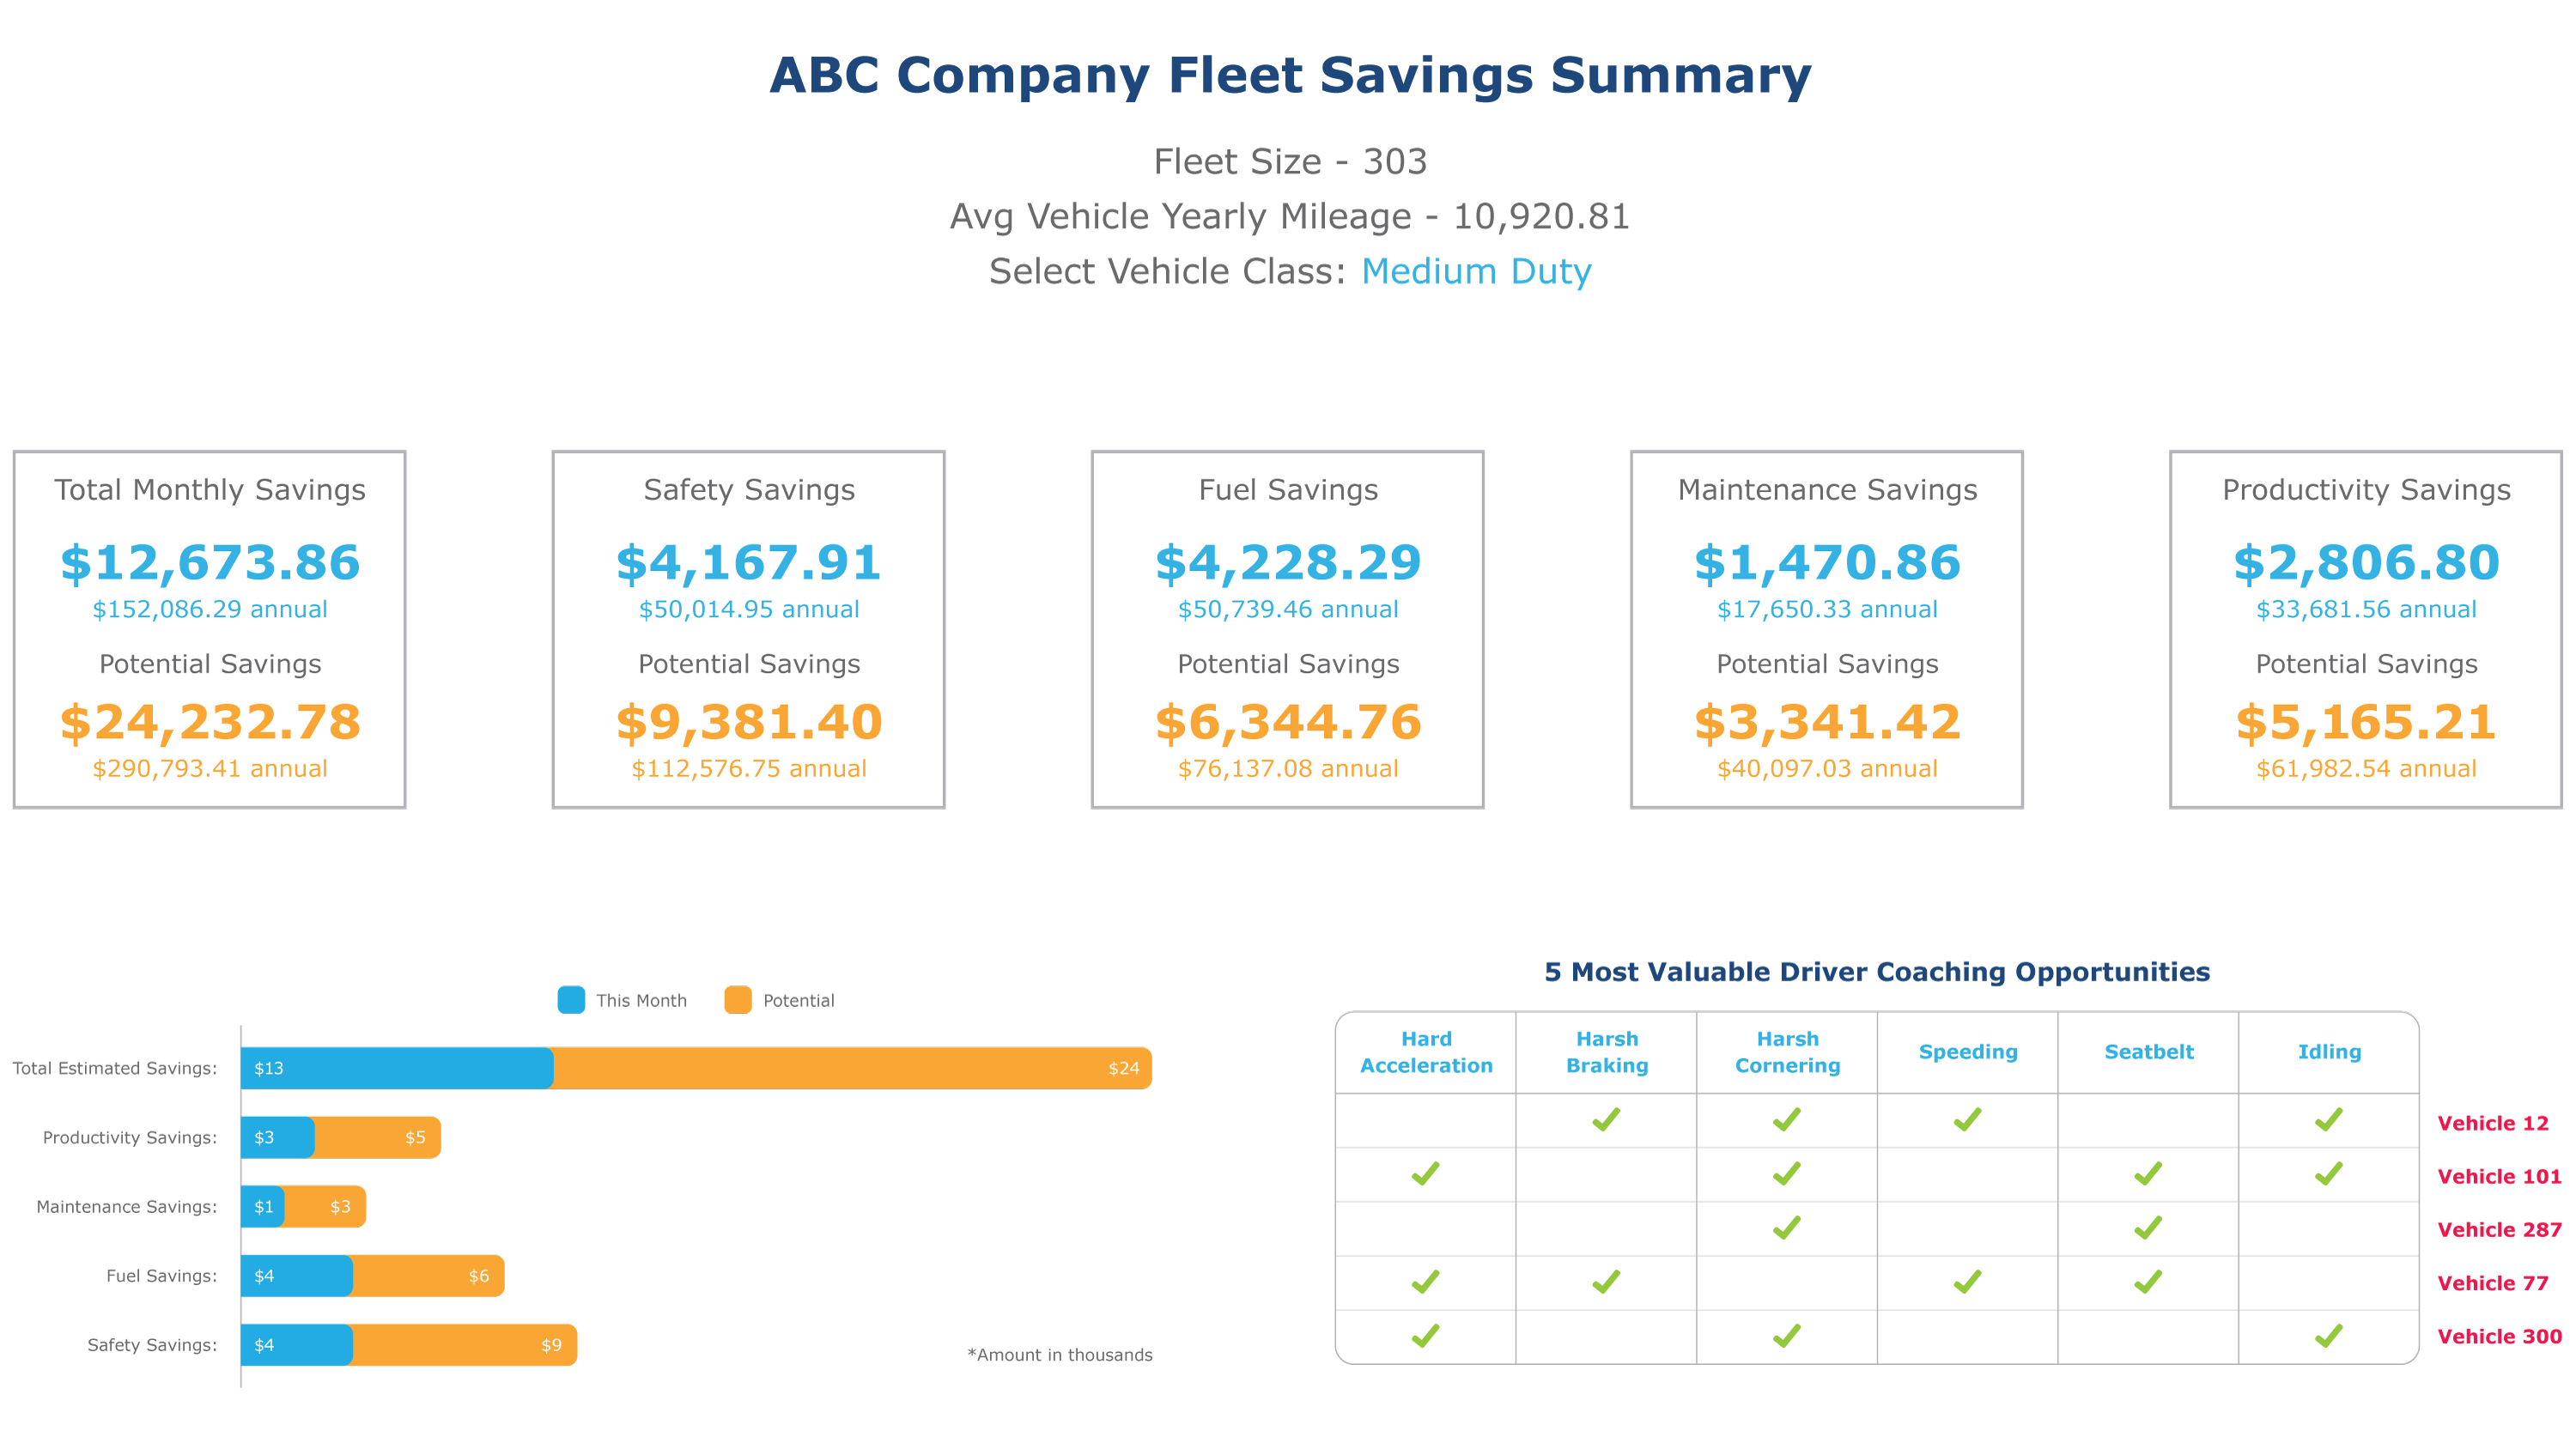
This tool allows fleet managers to quickly visualize their fleet’s performance, and more importantly, identify which drivers and/or savings categories should be targeted for improvement. Once these improvements have been implemented and the resulting benefits take effect, costs will decline, and profit margins will grow.
A lot of effort went into ensuring the accuracy of the information provided within the Fleet Savings Summary Report. This being said, it should be noted that the savings values within are highly normalized, and therefore are only applicable to a generic fleet.
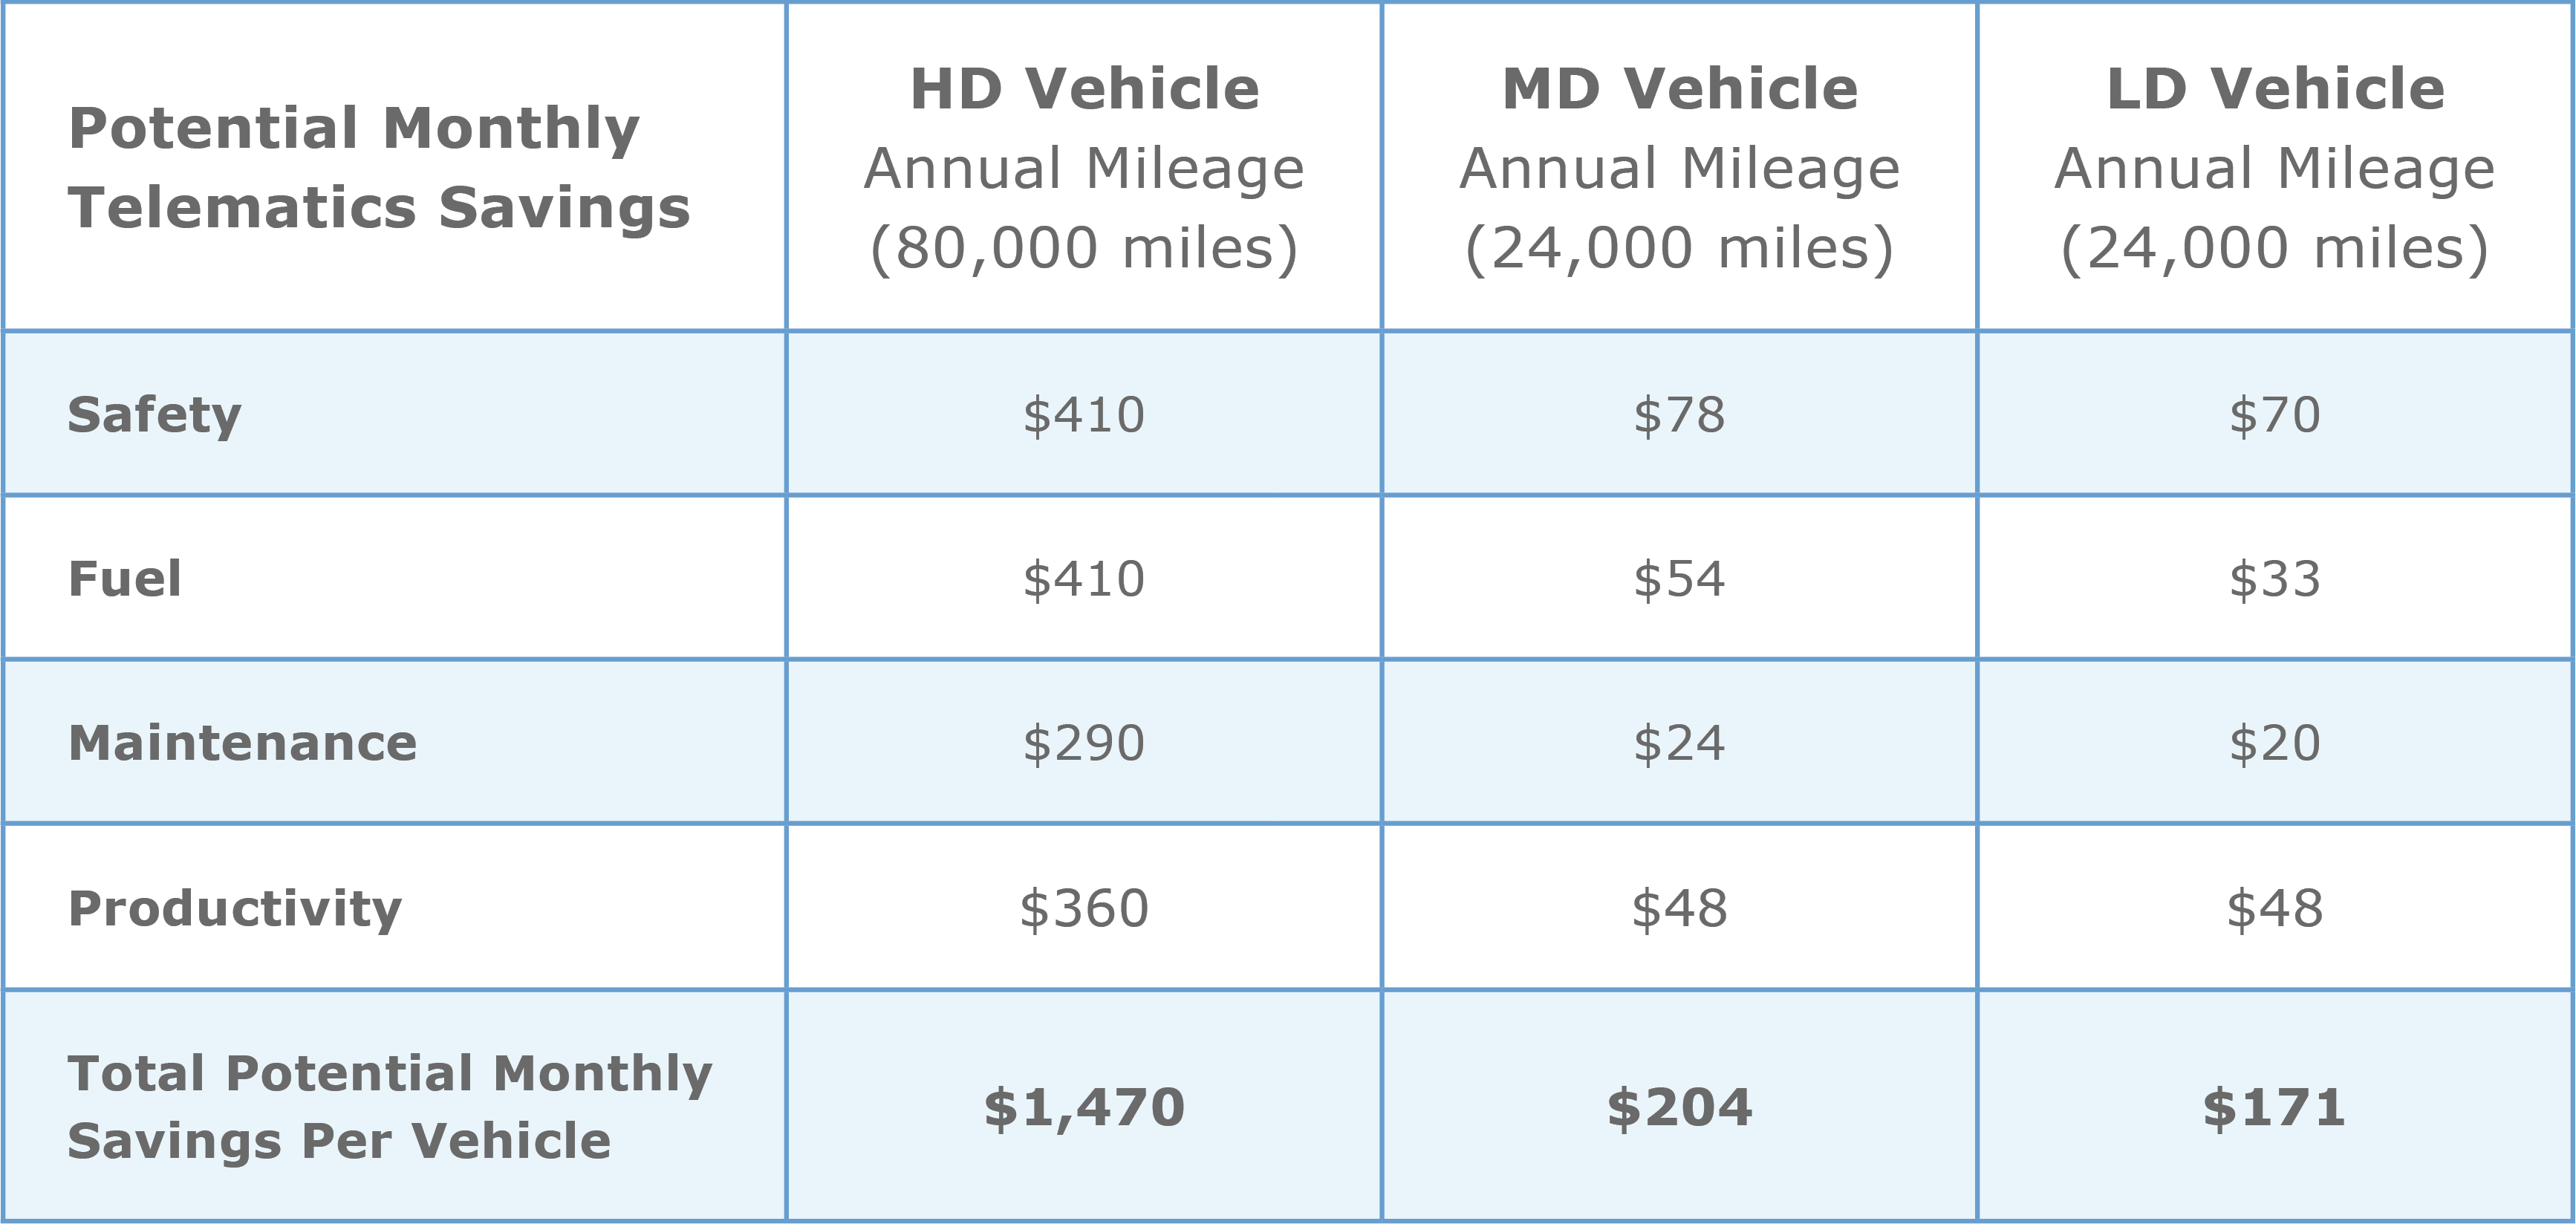
For a generic fleet, however, our research determined the existence of large telematics-related savings opportunities, as summarized in the table below.
Estimated Potential Monthly Telematics Savings Per Vehicle (USD):
Four Ways Fleets Can Reduce Costs
As described above, there are four specific areas where savings can be found: safety, fuel, maintenance, and productivity. Let’s look at each in more detail.
- Safety (Reducing Costly Vehicle Collisions): Each work-related accidents cost employers between $16,000 to $500,000 depending on their severity. Insurance companies have reported a 45% reduction in accidents and a 50% reduction in accident payout costs via the effective use of telematics, with an additional 5% to 25% reduction in comprehensive insurance cost.
- Fuel (Controlling Runaway Fuel Costs): The U.S. Department of Energy reports that rapid acceleration and heavy braking can reduce fuel economy by up to 33% for highway driving and 5% on city roads; while idling and speeding can also have drastic impacts on kilometre per litre. Combined with effective driver coaching initiatives, telematics can minimize aggressive driving behaviours and reduce fuel costs by as much as 14%.
- Maintenance (Reducing Repairs and Maintenance): Planned maintenance is a standard part of vehicle ownership, but unplanned repairs due to aggressive driving and vehicle misuse are an unnecessary cost to a fleet. In addition to the cost savings resulting from fewer scheduled maintenance appointments, a non-scheduled maintenance interruption can result in lost profits of between $400 to $700 per day. The Organization for Economic Co-operation and Development (OECD) reports that telematics technology can help a company reduce these scheduled and unscheduled maintenance and repair incidents by as much as 14%.
- Productivity (Increasing Workforce Efficiency): Driver compensation is often a large component of a fleet’s total operating budget. Market research suggests that telematics can increase workforce productivity and reduce labour costs by up to 12%.
The Importance of Driver Coaching in Fleet Management
Proactive management of driver behaviour is essential to any cost reduction exercise. By investing in driver coaching, and specifically focusing on the most costly drivers, a fleet can minimize their operating costs. Keep in mind that the drivers you need to target may change from month to month. That’s why using a telematics solution is essential, because it can objectively pinpoint the most costly or risky drivers based on numerous variables.
There are a variety of tools that can be used in driver coaching efforts, many of which are available from the Geotab Marketplace. Some examples include:
- Driver scorecard
- Top 5 Speeding Violations Reports
- Last 3 Months Fuel Trend Report
- Weekly Idle Cost Daily Trend Report
- GO TALK In-vehicle Verbal Feedback
- Mobileye Advanced Collision Prevention
Turn Your Fleet Into a Success Story
Many of our more efficient customers are benefiting from these telematics savings, as can be seen at http://www.geotab.com/success-stories. These customers deploy telematics and use its rich data to closely monitor fleet assets and proactively manage driver behaviour.
These same savings can be achieved by any fleet manager who is committed to using their telematics solution to its full extent. By pursuing these cost reduction opportunities, fleet managers can reduce their COI, improve their operating efficiency, and grow their bottom line.
To help fleet managers proactively manage their fleet operations and realize the savings described above, Geotab offers a wide range of tools.
Author: Jean Pilon-Bignell, Solutions Engineer
Download our industry-specific brochures:
Construction Vertical Brochure| Courier and Delivery Vertical Brochure | Field Sales & Services Vertical Brochure | Food and Beverage Vertical Brochure | Government Vertical Brochure | Mobility Transport Vertical Brochure | Oil Gas & Mining Vertical Brochure | Police and First Responder Vertical Brochure | Towing Vertical Brochure | Transportation and logistic Vertical Brochure | Utilities Vertical Brochure